Spectral Visualization
What it is
The imzML Browser lets you interactively explore the raw spectral data of your dataset at the pixel level. By clicking any pixel on the ion image, you can inspect its full mass spectrum and generate an ion image for any m/z value or molecular formula of interest, including ions not covered by the annotation results.
When to use it
- When you want to assess the spectral quality of your dataset at the pixel level.
- When you want to explore a specific m/z or molecular formula outside of the annotation results.
- When you want to see which peaks in a pixel's spectrum are annotated versus unannotated at your chosen FDR threshold and database.
How to use it
Here's a short video showing how to use the imzml browser:
What results look like
The browser is divided into two panels.
The Spectrum Browser on the left displays the full mass spectrum for the selected pixel. Peaks are color-coded: red diamonds for unannotated peaks and blue circles for peaks annotated at the chosen FDR threshold in the selected database. Filters above the spectrum let you toggle between showing all peaks or unannotated peaks only, and switch between a standard mass spectrum and a Kendrick plot view.
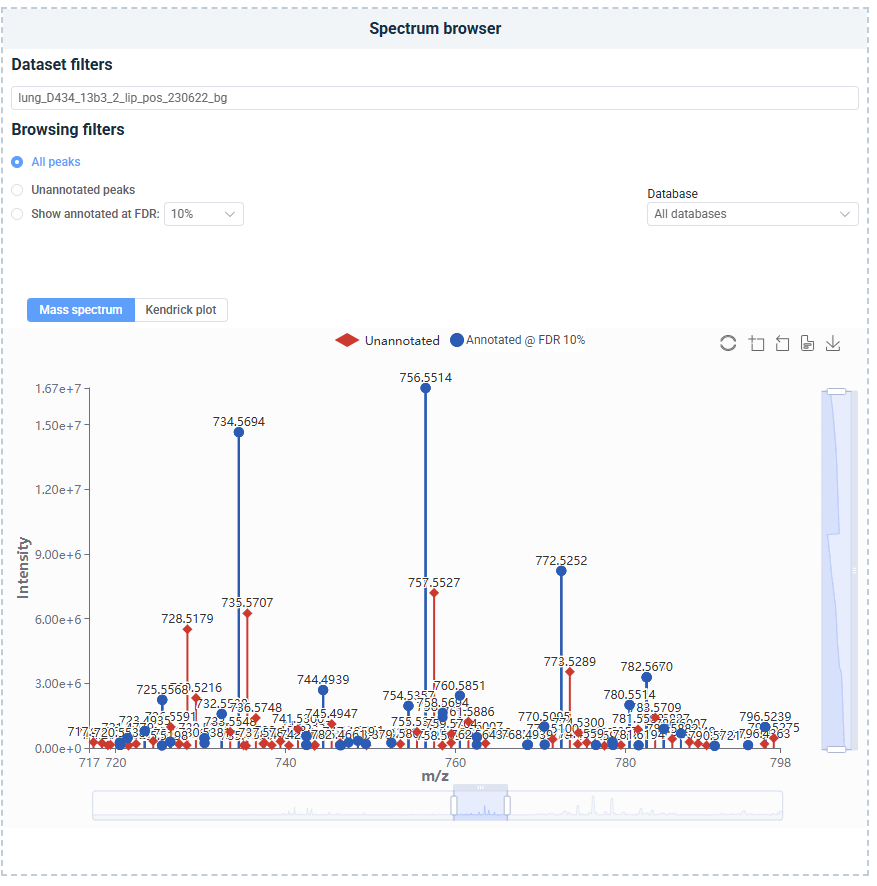 Spectrum browser panel showing m/z peaks color-coded by annotation status — blue circles for annotated peaks, red diamonds for unannotated. Source: dataset
The Image Viewer on the right displays the ion image for the m/z value and tolerance entered in the image filters. The formula field updates automatically when a matching molecular formula is available. Hovering over the tissue shows pixel coordinates and intensity above the image, and a color scale bar indicates the intensity range across the section.
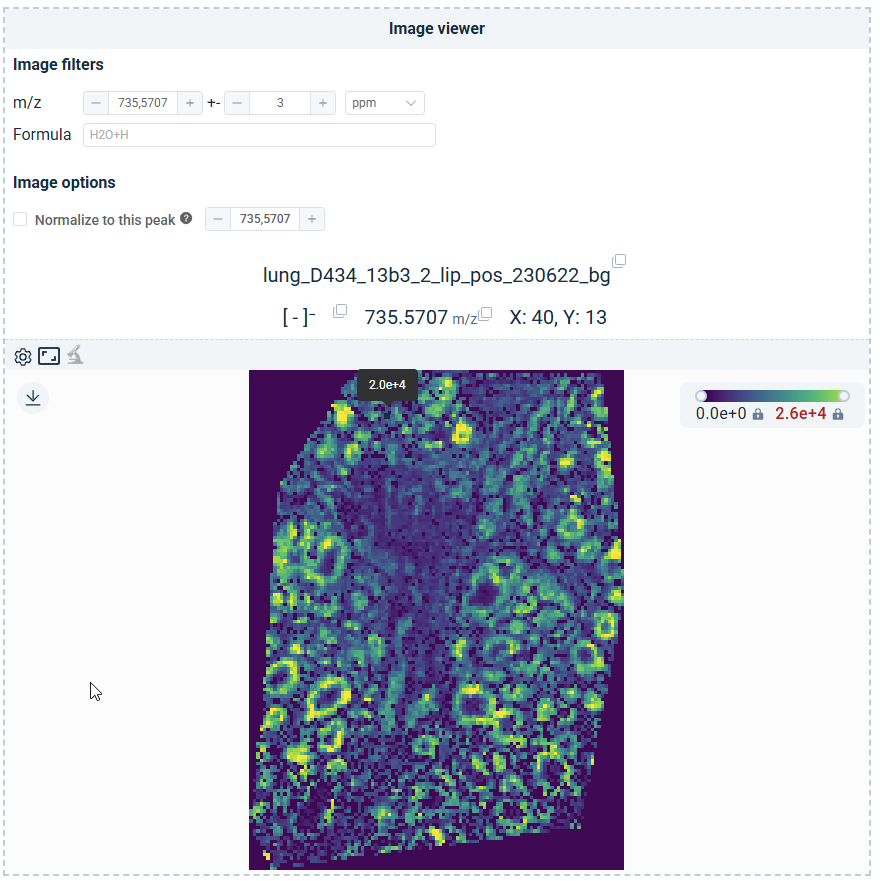 The image viewer panel displaying the ion image for the selected m/z, with pixel coordinates and intensity shown on hover. Source: dataset