ROI Differential Analysis
METASPACE Pro
Only available for METASPACE Pro users.
What it is
ROI Differential Analysis identifies which metabolites and lipids are enriched or depleted in each of your defined regions of interest relative to all other regions combined.
For each annotated ion, the analysis computes two effect-size metrics: log₂ fold change, which quantifies the magnitude of the intensity difference, and AUC (area under the ROC curve), which reflects how well the ion discriminates between the focal ROI and all other regions. Formal p-values are intentionally omitted: the spatial autocorrelation inherent in imaging MS data inflates false-positive rates when standard statistical tests are applied at the pixel level.
When to use it
- When you want to identify the molecular signature of a tissue region relative to its surroundings (for example, tumor core vs. the rest of the tissue).
- When you want to find the marker ions that best distinguish one region from all others.
- When you want to generate a ranked shortlist of candidate biomarkers for a region of interest.
How to use it
Follow the steps in this video:
What results look like
Once the analysis is complete, you are taken to the results page. It contains four interconnected components: a ranked results table, an ion image viewer, a LogFC x AUC plot, and a heatmap.
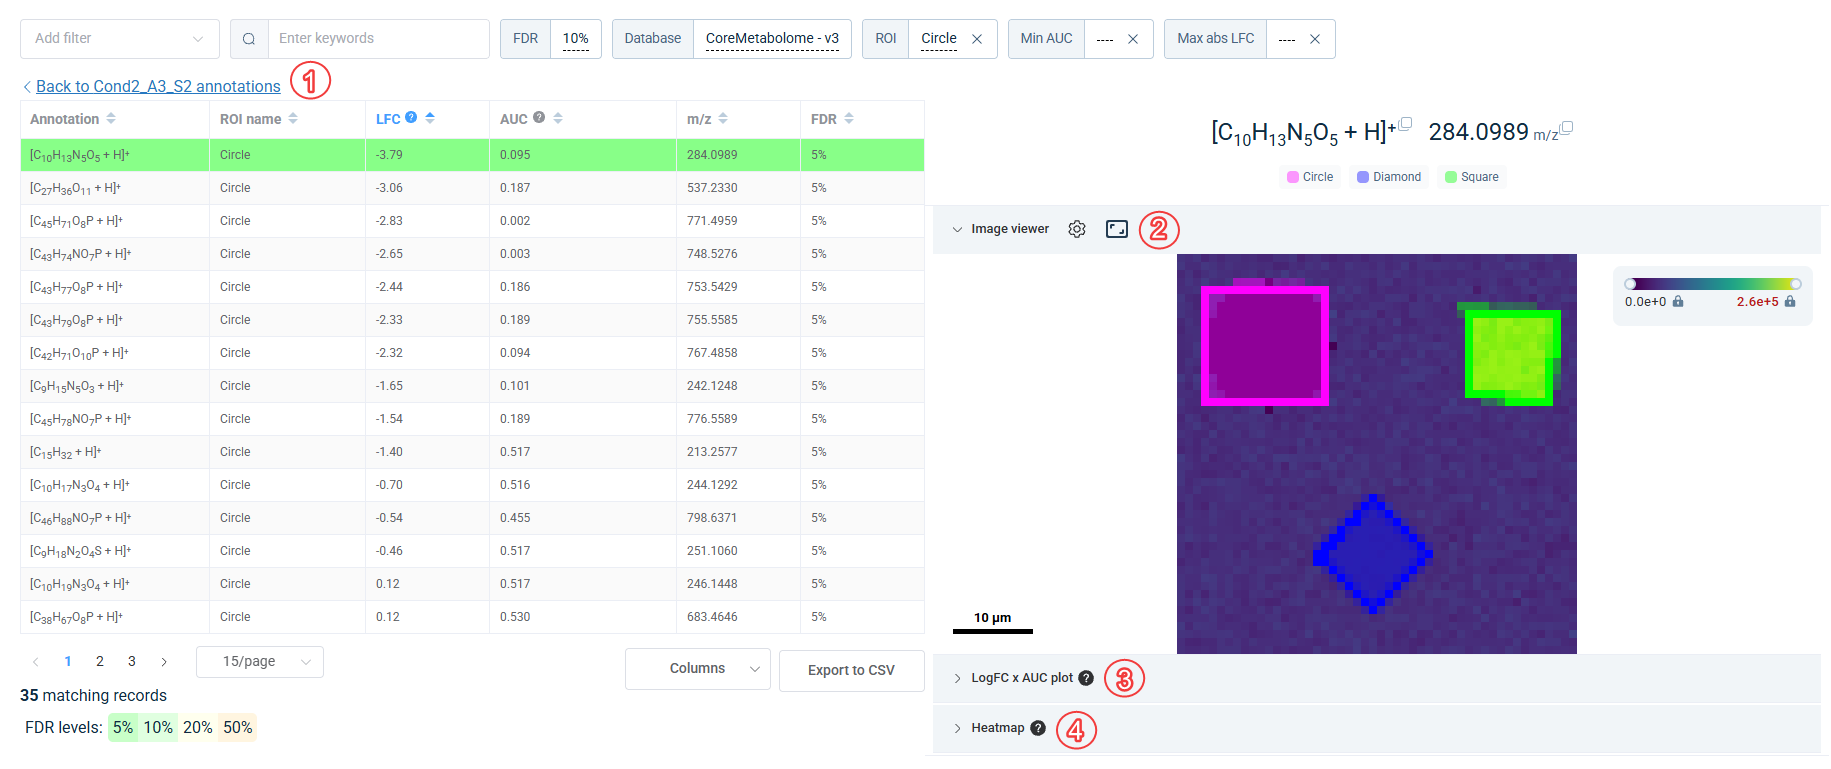 Results page layout showing the ranked table, ion image viewer, LogFC x AUC plot, and heatmap.
For a detailed explanation of each component, see the interpretation guide.