Detectability App
What it is
The Detectability App is an interactive tool for exploring the detectability and intensity of metabolite ions across a range of imaging MS protocols and technologies. It is built on a large-scale empirical study that measured the detectability of 172 biologically relevant metabolites across 24 MALDI imaging MS protocols and an interlaboratory comparison of 10 imaging MS technologies, including MALDI, DESI, and IR-MALDESI.
When to use it
- When planning a new experiment and selecting an appropriate imaging MS protocol.
- When you want to know which ions and adducts of a metabolite of interest are likely to be detected under your experimental conditions.
- When you want to understand the metabolite coverage limitations of your protocol before running the experiment.
- When interpreting annotation results and assessing whether an expected metabolite should have been detected given your setup.
How to use it
Here's a short video showing how to access and use the detectability app:
The app provides three data tabs — EMBL, INTERLAB, and ALL — corresponding to different subsets of the underlying study data. You can configure the X axis, Y axis, and color metric to build a custom chart, and apply filters such as polarity or neutral losses to narrow down the results.
What results look like
Each point in the chart represents a metabolite ion under the selected filters. The screenshot below shows the chart panel with axes and color metric configured and filters applied.
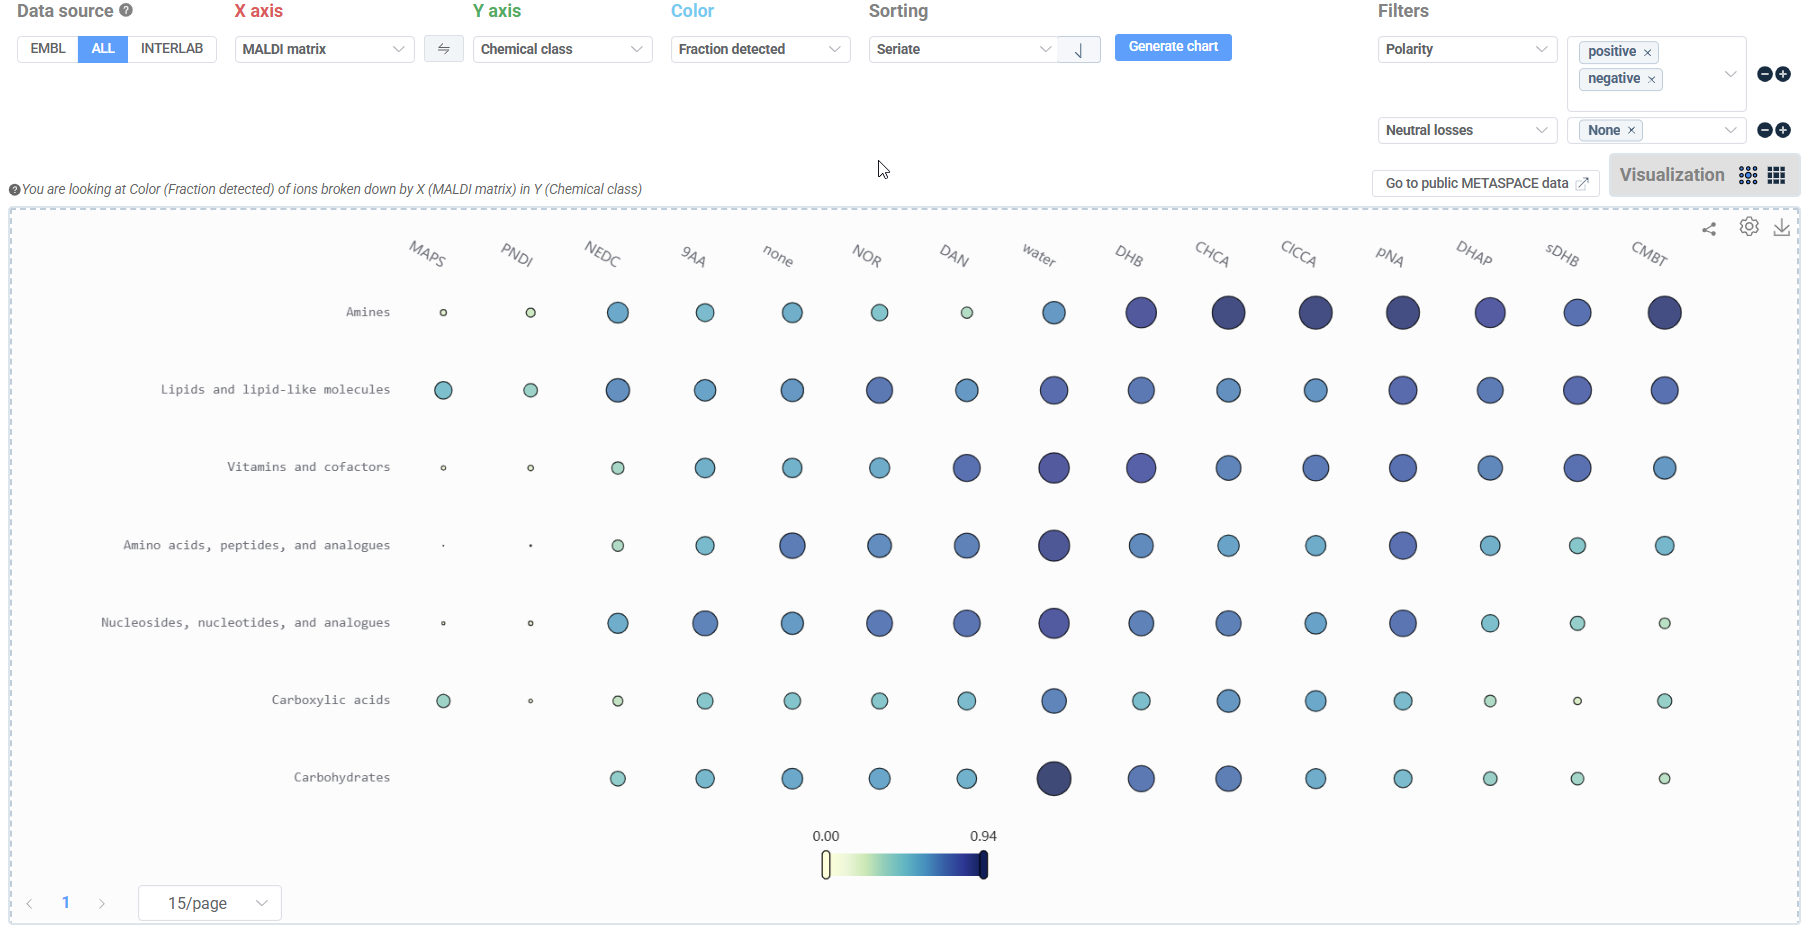 Generated detectability chart with MALDI matrices as x-axis, chemical class as y-axis and colored by fraction detected.
For an in-depth understanding of the underlying data and methodology, check out the Detectability App paper.