Colocalization
How it works
For each annotated ion image in your dataset, METASPACE automatically computes a co-localization score against every other annotated ion image. The score quantifies how similar the spatial distributions of two ions are across the tissue section. METASPACE uses the cosine similarity applied after median thresholding — a method benchmarked against expert rankings from 42 imaging MS specialists across nine research groups and shown to perform on par with human-level agreement. For full methodological details, see Ovchinnikova et al., Bioinformatics, 2020.
Where to find it
Co-localization results are displayed in the second collapsible panel on the annotation page — after the Molecules panel and before the Diagnostics panel. When you select any annotation from the table on the left, the panel updates to show the top co-localized annotations for that ion, along with their ion images.
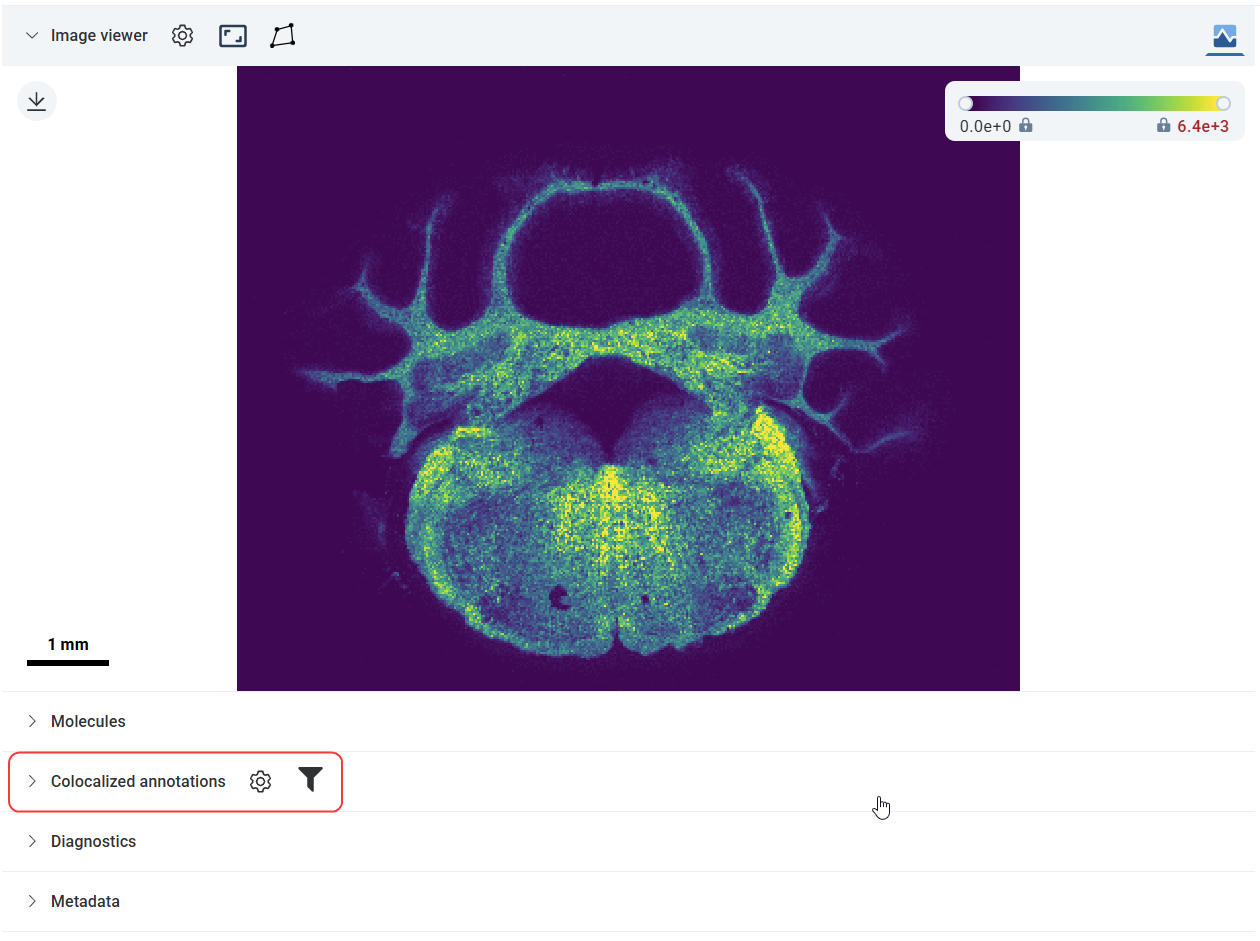 The co-localization panel (highlighted) on the annotation page. Source: dataset
How to read it
The co-localization panel shows up to 12 ion images in a grid, ordered from highest to lowest co-localization score. The first ion image is always the reference annotation — the ion you currently have selected — so you can visually compare it against the others. The remaining ion images show the top co-localized annotations from the same dataset, capped at 11.
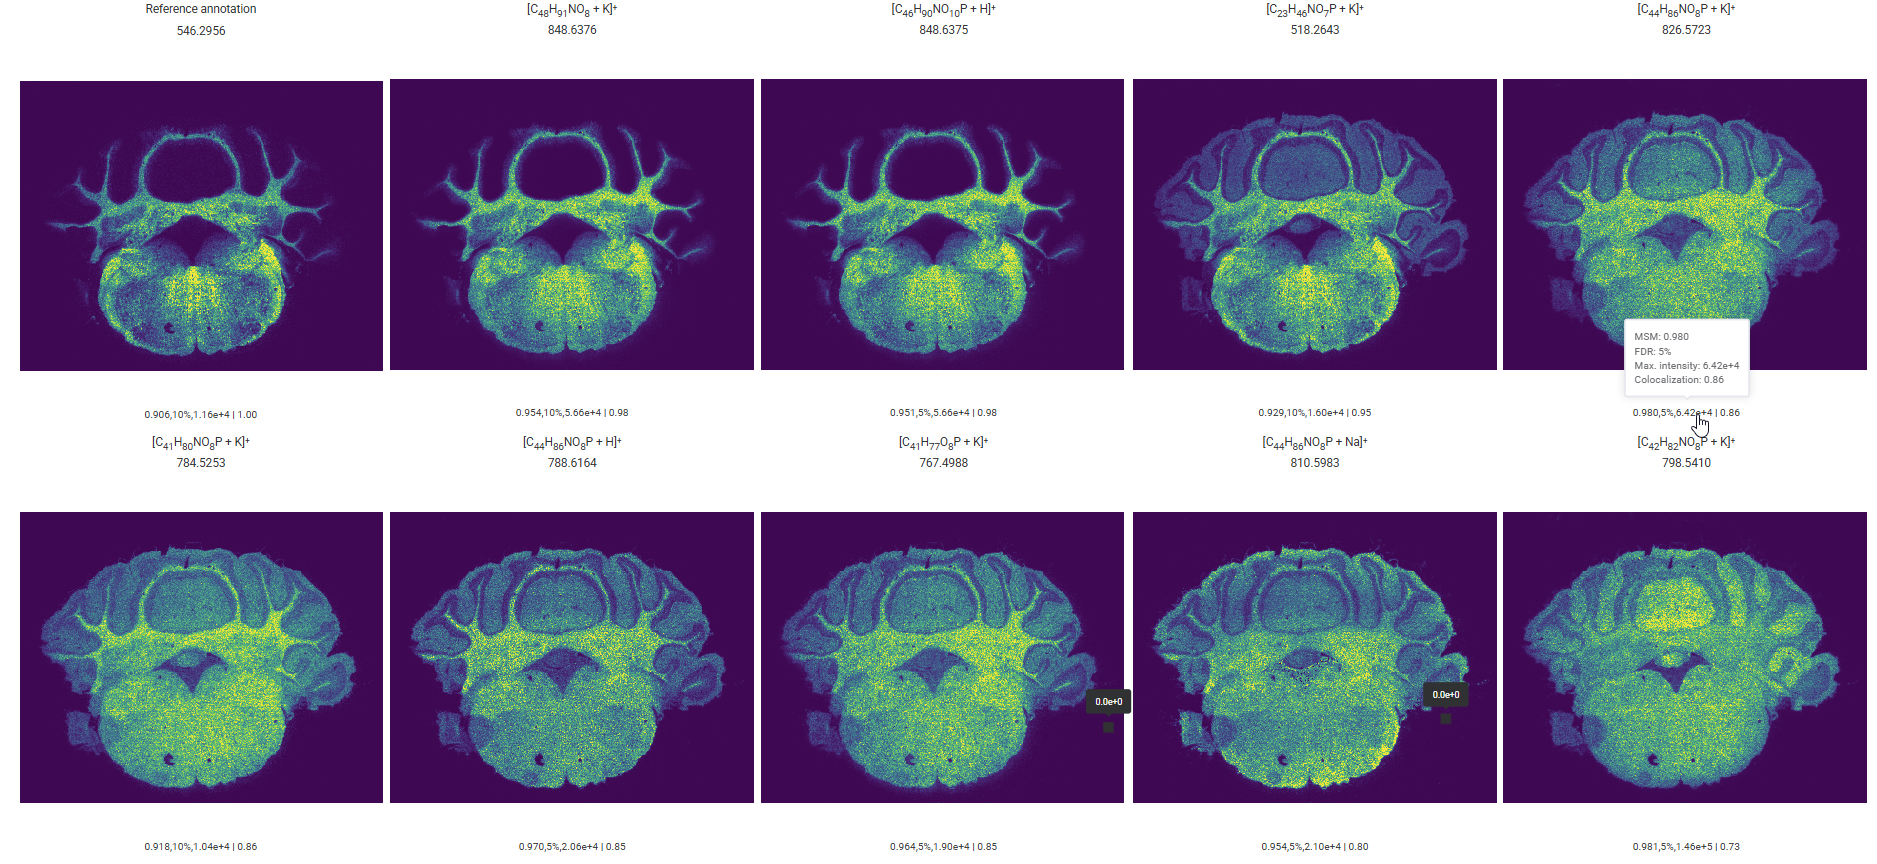 The co-localization panel showing the reference annotation alongside the top co-localized ion images, each with its score and metadata. Source: dataset
Each card displays:
- The ion formula and m/z value
- The primary isotope peak ion image
- A summary line with the MSM score, FDR level, and maximum intensity — hover over it for the full breakdown
- The co-localization coefficient (shown after
|in the summary line)
The score ranges from 0 to 1, where 1 indicates perfect spatial overlap and 0 indicates no spatial similarity. In practice, scores above ~0.7 represent strong co-localization that is visually apparent, while scores below ~0.3 are generally indistinguishable from unrelated ions.
The score is computed on the median-thresholded ion images — meaning only pixels with intensities above the median are considered. This makes the score sensitive to the high-intensity regions of each image, which is consistent with how experts visually judge co-localization.
Filtering the table by co-localization
The co-localization panel header contains a filter icon (funnel). Clicking it applies the currently selected ion as a co-localization filter to the annotation table on the left. Two things happen at once:
- The table is filtered to show only annotations co-localized with the selected ion.
- The table is sorted by co-localization score in descending order, and a Colocalization column appears showing the score for each annotation.
This lets you explore the full ranked list of co-localized annotations — not just the top 12 shown in the panel — and apply additional filters such as FDR or adduct on top. To clear the filter, remove the co-localization filter chip from the filter bar.
Common patterns and pitfalls
- High score but different anatomical structures — a high score means the pixel intensity patterns are similar, not necessarily that the molecules are functionally related. Always look at the ion images side by side to visually confirm the pattern.
- Low scores for low-abundance ions — noisy or low-signal ion images tend to score poorly against everything, including potentially true co-localizations. Be cautious interpreting co-localization for ions near the detection limit.
- Co-localization is dataset-specific — scores reflect the spatial patterns within your particular dataset. The same two ions may score differently across datasets from different tissue types or sample preparations.