Ion Image Visualization
What it is
The ion image viewer on the annotation page includes a set of built-in tools for transforming and displaying ion image intensities. These tools allow you to adjust intensity scaling, apply normalization, change the color map, and add a scale bar to the image.
Three scaling methods are available: linear, logarithmic, and equalized histogram. Each can be combined with hotspot removal, which clips outlier pixels to prevent a small number of high-intensity pixels from dominating the global intensity scale.
Normalization is selected from the Normalization dropdown, which offers three per-pixel normalization methods:
- TIC — divides each pixel by its total ion current, i.e. the sum of all peak intensities in that pixel's spectrum.
- RMS — divides each pixel by the root mean square of the peak intensities in its spectrum.
- Median — divides each pixel by the median peak intensity in its spectrum.
When to use it
Normalization corrects for pixel-to-pixel variation in overall signal intensity. TIC is by far the most commonly used method and is the recommended starting point for most datasets. RMS and Median are alternatives that are less sensitive to a few dominant peaks or to a large number of low-intensity noise peaks respectively, and can be worth trying when the TIC of a pixel is driven by a small number of very intense ions.
If a dataset was processed before RMS and median normalization were introduced, those options are not available and selecting one shows a message asking you to reprocess the dataset. Reprocessing computes the missing values and makes all three methods available.
Intensity scaling should be used with caution. Unless there is a specific reason to apply logarithmic or equalized histogram scaling, it is recommended to keep linear scaling and enable hotspot clipping instead. Aggressive scaling can obscure real intensity differences across the tissue.
Color maps can be changed freely based on preference or to improve contrast for a specific ion image.
How to use it
Here's a short video showing how to access the ion image viewer settings:
Here's a short video showing how the interactive intensity slider works:
What results look like
After applying a transformation, the pixel intensity values update and the range displayed on the intensity slider (min/max) changes to reflect the chosen scaling method and normalization settings. You can drag the slider handles to manually adjust the minimum and maximum intensity thresholds displayed in the image.
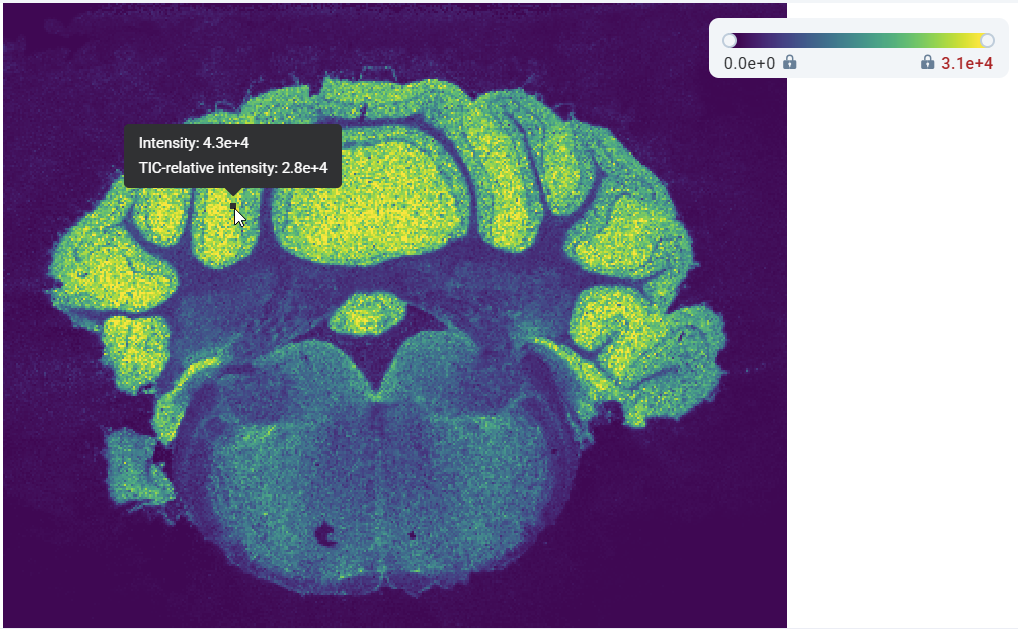
When normalization is active, a badge over the ion image names the method in use (for example TIC normalized), and hovering over a pixel reports its normalized value (for example TIC-relative intensity).
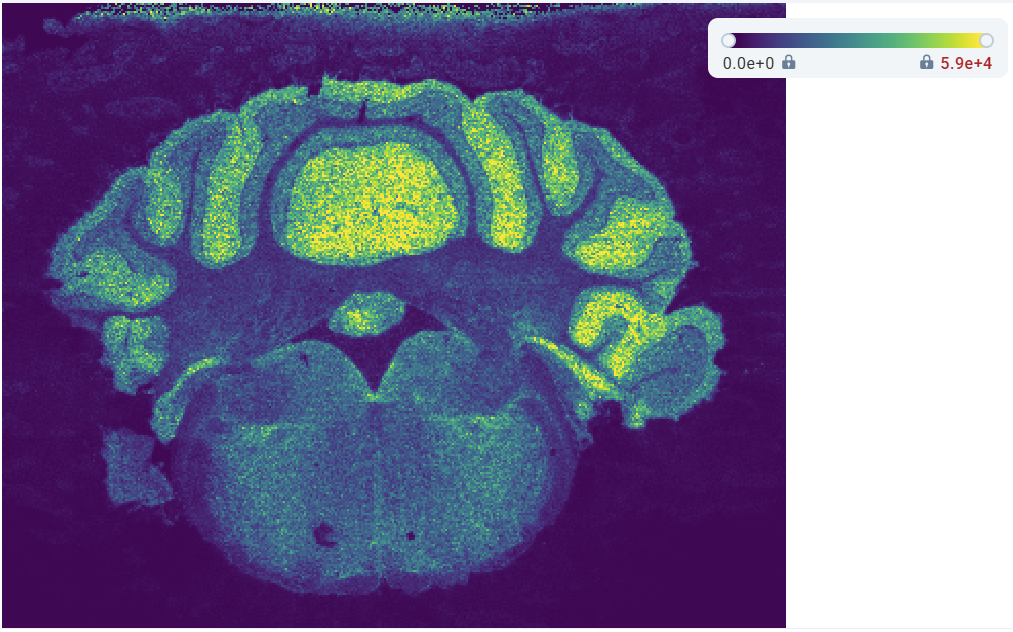
Below are side-by-side examples of the same ion image before and after TIC normalization for a mouse brain dataset: