Understanding ROI differential analysis
METASPACE Pro
Only available for METASPACE Pro users.
How it works
For each annotated ion, METASPACE computes two metrics that together quantify how its spatial distribution differs between the focal ROI and all other regions combined: log₂ fold change (the ratio of mean intensities between the focal ROI and all others) and AUC (the area under the ROC curve, measuring how consistently the ion is higher in the focal ROI across all pixel pairs). These metrics are used instead of p-values because pixels in imaging MS data are spatially autocorrelated: neighbouring pixels share signal and are not independent observations, making standard statistical tests unreliable. The AUC metric was inspired by the effect size approach described in the OSCA single-cell analysis book, adapted from the scran R package.
Where to find it
Once the analysis completes, you are redirected to a dedicated results page. The page contains four interconnected components: a ranked results table, a LogFC x AUC plot, a heatmap, and an ion image viewer.
How to read it
The ranked results table
The table lists all annotated ions sorted by log₂ fold change and AUC by default. Each row shows the ion's formula, adduct, and both metrics for each ROI.
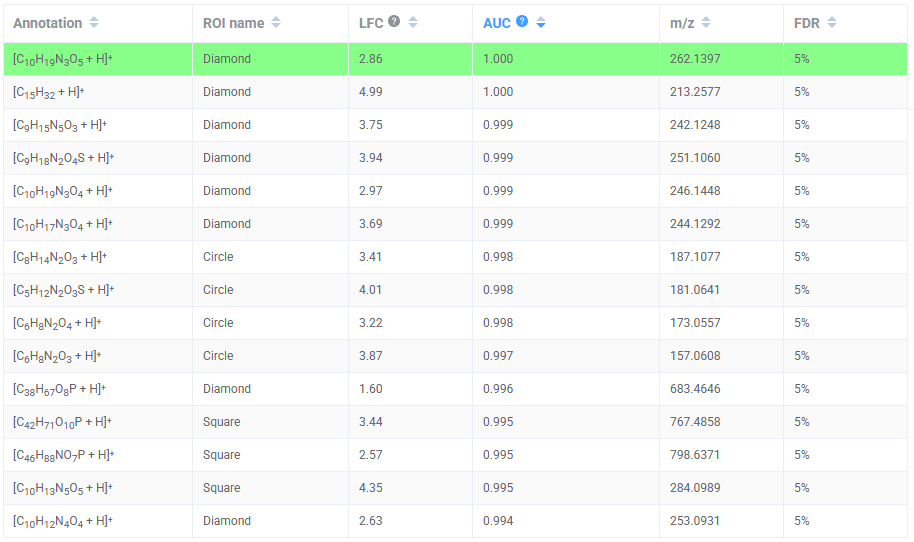 Results table with the log₂ fold change column and the AUC column.
The two metrics measure different things and can sometimes point in different directions:
- Log₂ fold change answers: how much higher is the mean intensity? A value of 1 means twice as high; 2 means four times as high. Negative values indicate depletion in the focal ROI relative to the comparison.
- AUC answers: how consistently higher is it? An AUC of 1 means every pixel in the focal ROI outranks every pixel in the comparison. AUC of 0.5 means no discriminative power. Values below 0.5 indicate the ion is consistently lower in the focal ROI.
For a confident hit, you want both to agree: high fold change and high AUC. When they disagree, read the combination: a high fold change with low AUC often means a few bright pixels in the ROI are driving the average rather than a genuine region-wide enrichment. A high AUC with modest fold change suggests a consistent but subtle enrichment spread across many pixels.
The LogFC x AUC plot
The LogFC x AUC plot shows each ion as a dot based on a one-vs-all comparison for the selected ROI. The x-axis shows log₂ fold change (log2FC) and the y-axis shows AUC, where 0.5 is random, above 0.5 means the ion is enriched in the ROI, and below 0.5 means it is depleted. Dots are colored by the direction of log2FC. For best results, view one ROI at a time.
Ions in the top-right quadrant are both strongly enriched and highly discriminative and are your strongest candidates for region-specific markers.
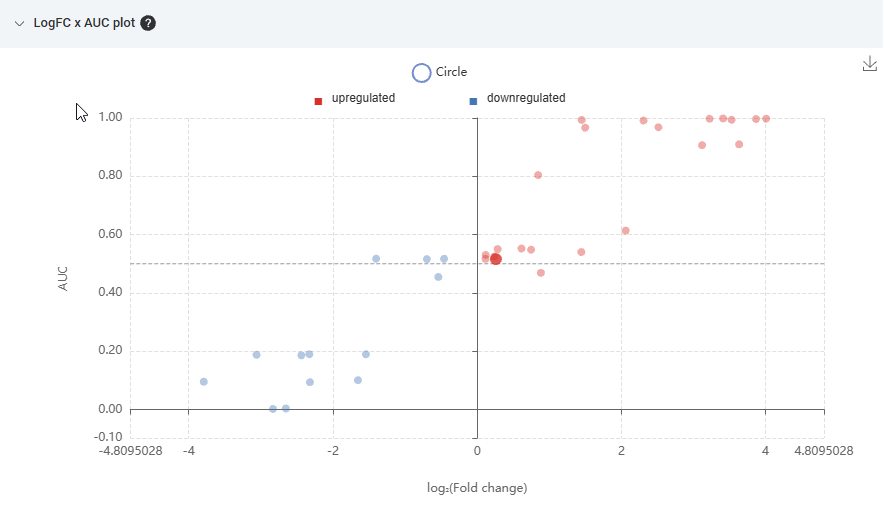 LogFC x AUC plot showing the top-right quadrant of strongly enriched ions, ions near the x-axis with fold change but low discriminability, and the selected ion highlighted.
Clicking any point in the LogFC x AUC plot highlights the corresponding ion in the results table and loads its ion image in the viewer.
The heatmap
The heatmap shows the top 5 ions across all ROIs, selected based on AUC. Each row is an ion (as listed in the results table) and each column is an ROI. Both the cell color and the cell label show log₂ fold change (log2FC). Use the log2FC slider to adjust the threshold; applying a minimum absolute AUC filter can further refine the results. Any selections or filters applied here are reflected in the table. Unlike the LogFC x AUC plot, which is best read one ROI at a time, the heatmap highlights top ions across all ROIs simultaneously, making it useful for spotting which ions are co-regulated across regions and which are specific to just one.
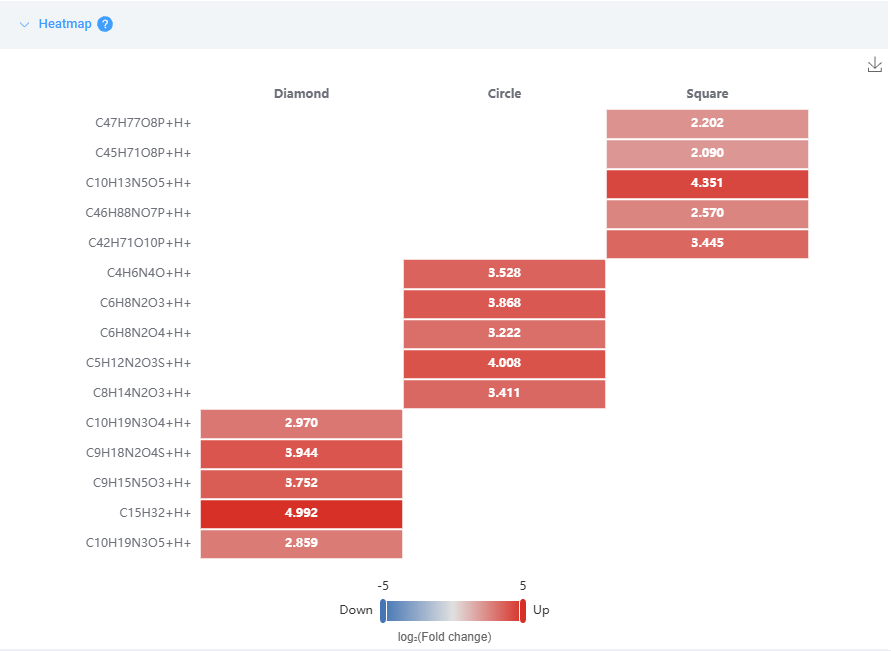 Heatmap showing ions specific to one ROI, ions enriched across multiple ROIs, and depleted ions.
The ion image viewer
Selecting any ion from the table, LogFC x AUC plot, or heatmap loads its ion image in the viewer with the ROI boundaries superimposed. This is the ground truth check: always visually confirm that the spatial pattern behind the numbers matches what you expect biologically before drawing conclusions.
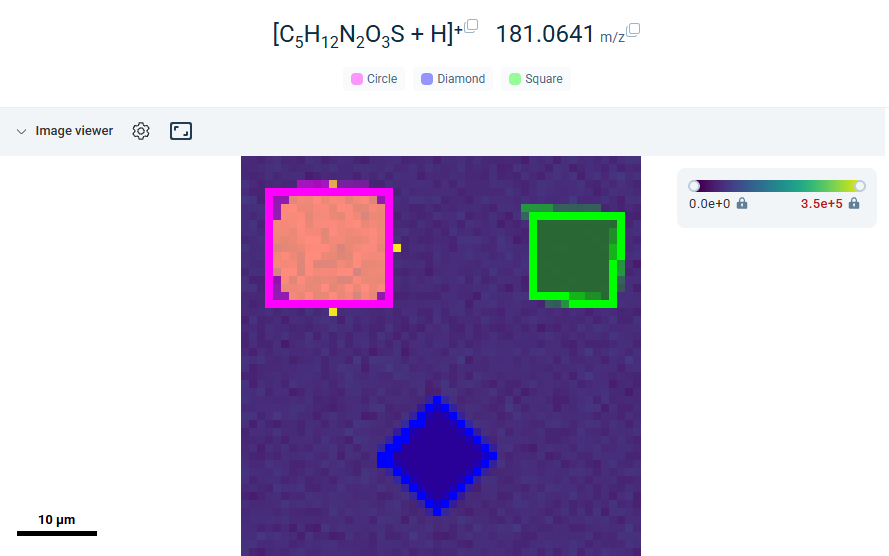 Ion image viewer with ROI boundaries overlaid on the selected ion.
Common patterns and pitfalls
- High fold change, low AUC: a few pixels with very high intensity inside the ROI are inflating the mean. Look at the ion image to check whether this is a genuine biological hotspot or a noise artifact.
- High AUC, modest fold change: the ion is consistently enriched across pixels but the magnitude is small. These ions can still be biologically meaningful, particularly for subtle tissue differences.
- All ions showing high fold change in one ROI: check whether that ROI is very small. Very small ROIs can produce inflated fold changes driven by sparse but high-intensity pixels rather than true region-wide enrichment.
- Heatmap with no clear pattern: if no ions cluster by ROI in the heatmap, the molecular differences between your ROIs may be subtle. Consider whether the ROI boundaries were drawn in biologically meaningful locations, or whether the FDR threshold is too strict and is excluding relevant annotations.
- Fold change without biological meaning: fold change is computed on raw annotation intensities, which are not normalized across the whole tissue. An ion that appears enriched in one ROI may partly reflect local ionization efficiency differences rather than true biological variation. Always interpret results in the context of the ion image.