Understanding annotation page
How it works
During annotation, METASPACE scores each candidate ion : defined as a combination of a molecular formula from the selected annotation database and an ion adduct — against the submitted imaging MS dataset. Each ion receives a score between 0 and 1 based on three measures: how structured its ion image is (spatial chaos), how well the relative intensities of its isotopic peaks match the theoretical prediction (spectral isotope), and how well the spatial distributions of those isotopic peaks co-localize (spatial isotope). In the default rule-based method (MSM), these three measures are multiplied equally. In METASPACE-ML, the same measures — plus two additional m/z error scores — are combined using a machine learning model trained on thousands of public METASPACE datasets, which adaptively weights each measure depending on the data context.
To distinguish true annotations from false positives, METASPACE uses a target–decoy approach: each candidate ion is ranked against a set of implausible decoy ions — constructed from the same molecular formulas but with chemically implausible adducts — and a False Discovery Rate (FDR) is estimated per adduct group. Annotations are then reported at a user-selected FDR threshold (default 10%), meaning that on average no more than 1 in 10 reported annotations is a false positive. Annotations are at the level of molecular sum formulas. For full methodological details, see the MSM paper and the METASPACE-ML paper.
Where to find it
The annotation page is the main results view for any dataset in METASPACE. It consists of an annotation table on the left, an ion image viewer on the right, and a series of collapsible diagnostic panels below the viewer. The screenshot below shows the full layout.
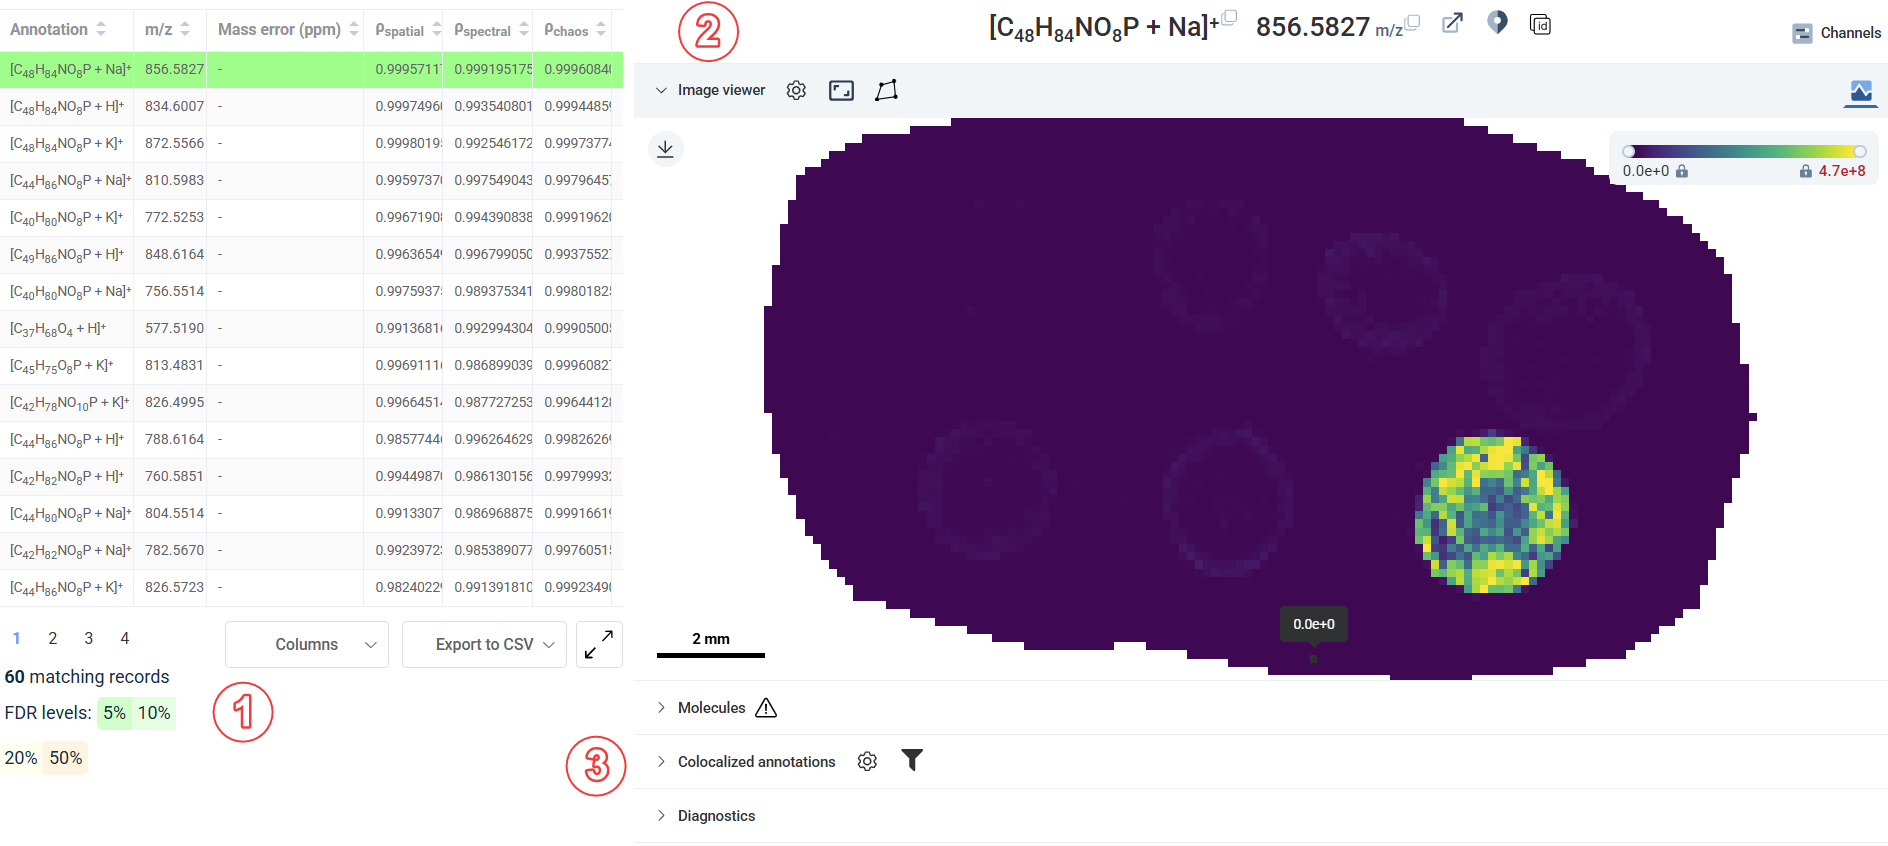 The annotation page: ① annotation table (left), ② ion image viewer (center), ③ diagnostic panels (below the viewer). Source: dataset
How to read it
MSM score and diagnostics
The MSM score appears in the annotation table and summarizes confidence in a given annotation. It is composed of three sub-scores:
- ρ spatial — correlation between ion images of the isotope peaks, comparing the principal peak against the others weighted by theoretical abundances
- ρ spectral — compares average image intensity per isotope against theoretical abundances, considering only pixels where the principal peak is present
- ρ chaos — estimates how spatially informative the principal peak ion image is
 Diagnostic panel showing the spatial, spectral, and chaos sub-scores for a selected annotation. Source: dataset
If METASPACE-ML is enabled, two additional measures are shown alongside the MSM sub-scores:
- m/z error (abs) — m/z error between observed and theoretical for the first isotope
- m/z error (rel) — difference between observed and theoretical for the 2nd–4th isotopes, relative to the first isotope error
You can also follow the corresponding interactive tour on Diagnostic plots for a hands-on walkthrough.
Ion images of each isotope peak
The diagnostic panel displays ion images for the first four most intense isotope peaks. These serve as a visual check of spatial correlation between peaks and whether peaks are above the noise threshold.
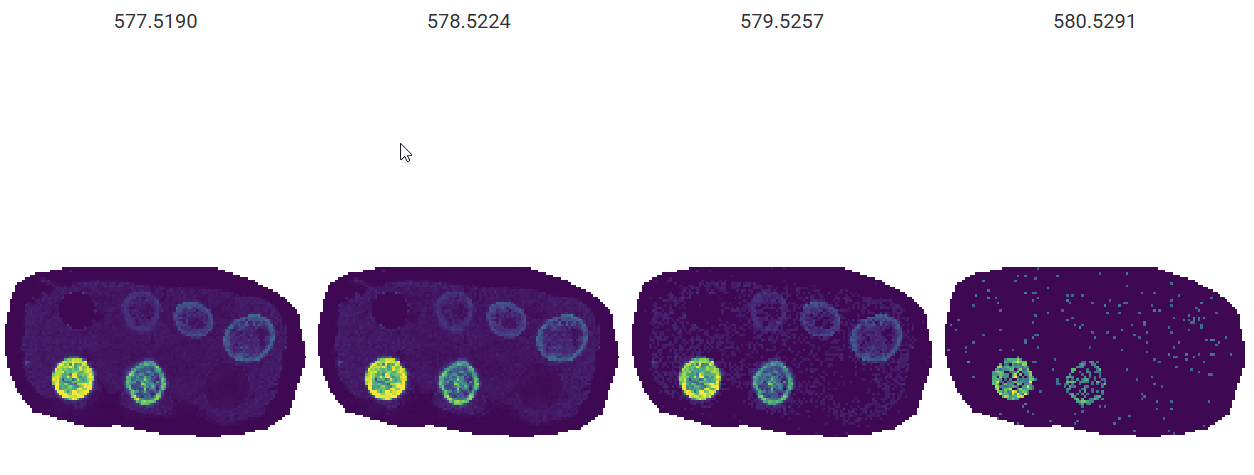 Ion image strip showing the first four isotope peaks for the selected annotation, each scaled independently. Source: dataset
Note that intensities are scaled independently per image — if they weren't, all images beyond the first would appear very dim.
Isotope pattern match
The isotope pattern plot shows the theoretical pattern alongside the observed total intensities. You can zoom using the mouse, reset the view by double-clicking, and toggle between relative and absolute intensity by clicking the y-axis label.
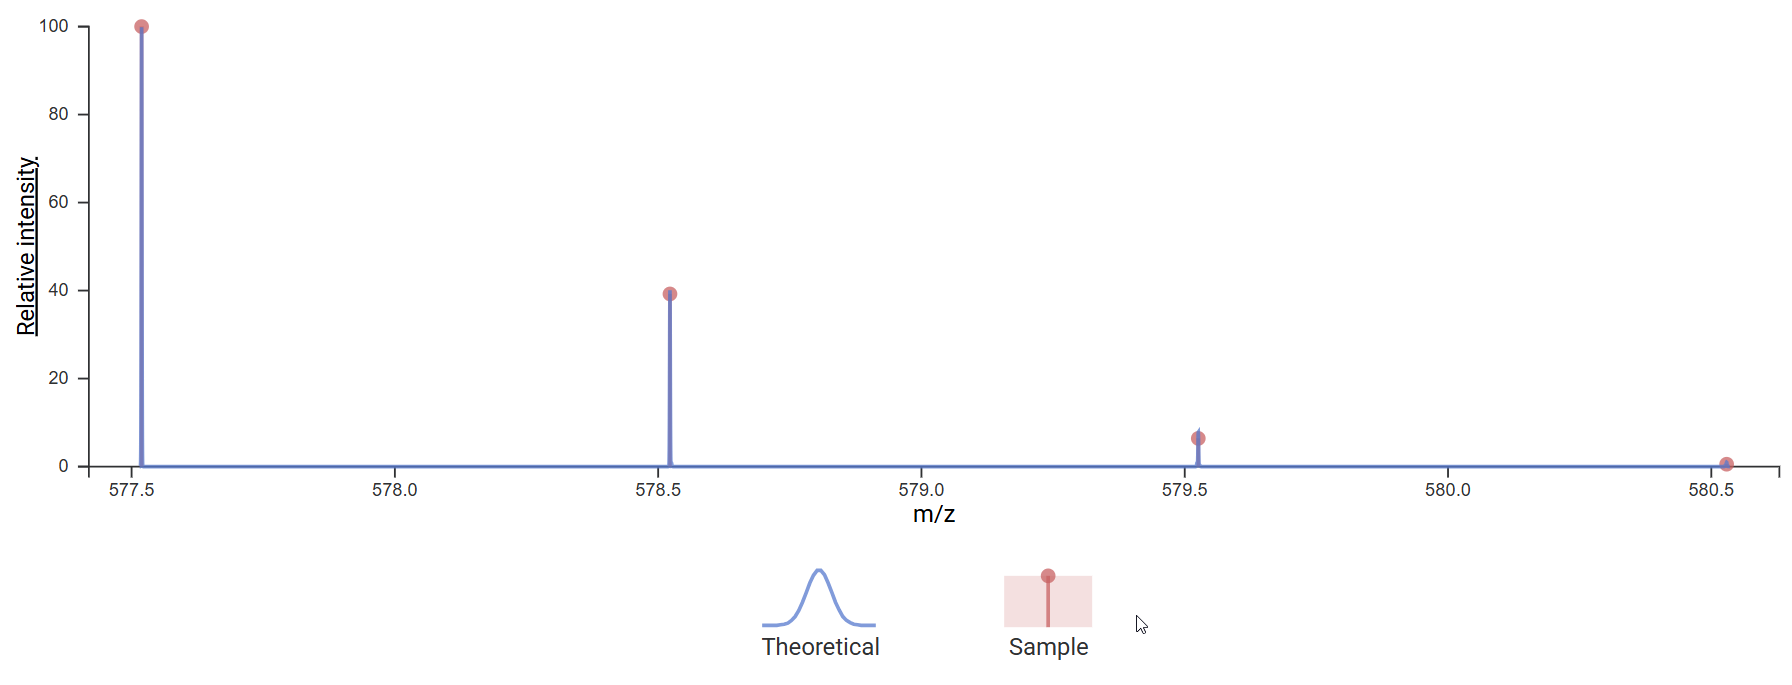 Isotope pattern plot comparing observed intensities (bars) against the theoretical distribution (line). Source: dataset
Observed intensities that are somewhat lower than theoretical are common, due to zero-filling of pixels below the detection limit. Intensities substantially higher than expected often indicate overlap with another ion.
Isomeric and isobaric ambiguity
Below the ion image viewer, METASPACE displays the possible compounds corresponding to the selected annotation, based on the chosen database. There are two distinct types of ambiguity to be aware of:
Dataset-driven ambiguity arises from the data itself, regardless of the database chosen:
- Isobaric ions — other ions with a different sum formula (and possibly different adduct) that fall within the same m/z ± ppm window. FDR is calculated separately per adduct group, so isobaric annotations with different adducts may show different FDRs.
- Isomeric ions — different adducts resulting in the same sum formula and m/z. These are rare.
Database-driven ambiguity comes from the annotation database itself:
- Isomeric molecules — neutral compounds sharing the same chemical formula but differing in structure. These are very common and represent the largest source of uncertainty in MS1 datasets. The FDR should not be used to decide which isomeric molecule is more likely to be correct.
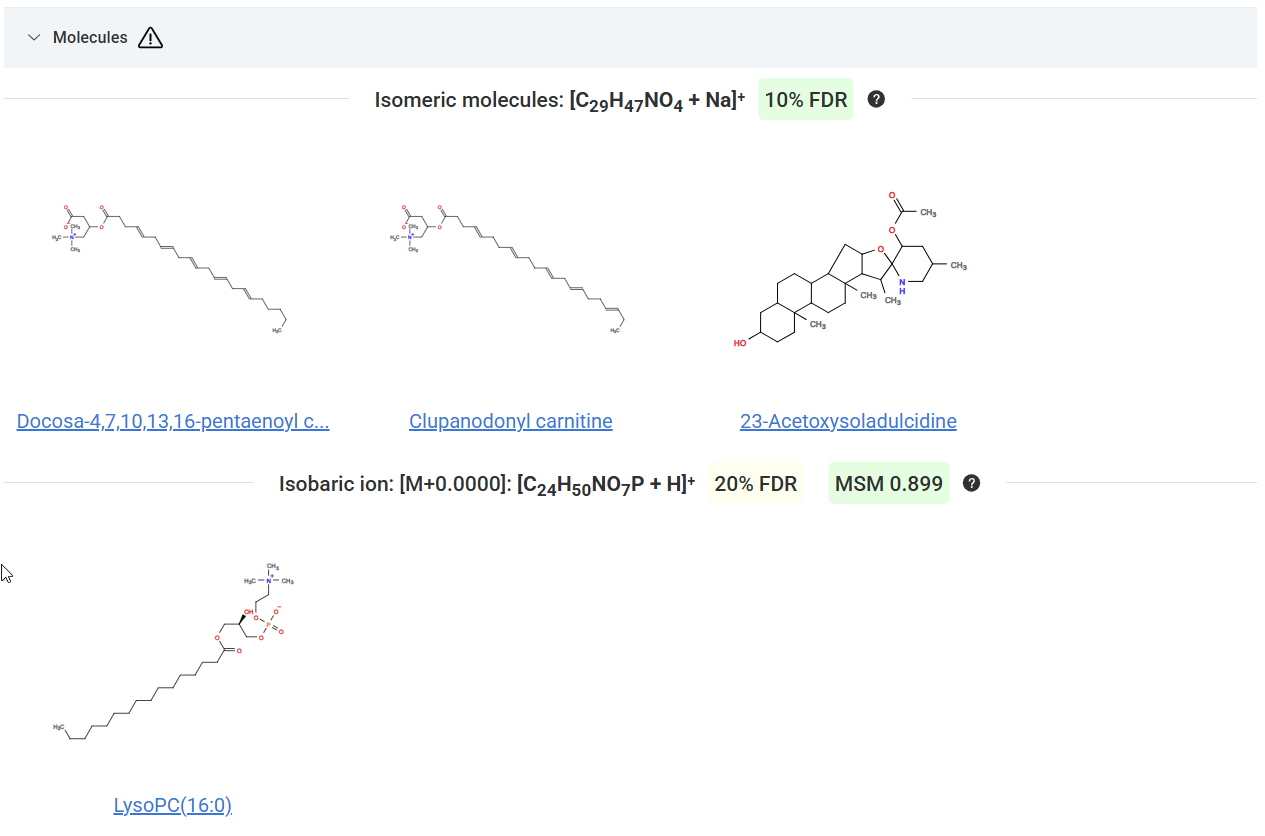 Ambiguity panel listing isobaric and isomeric candidates for the selected annotation. Source: dataset
You can show or hide the number of isomeric molecules, isomeric ions, and isobaric ions using the table columns. To reduce database-driven ambiguity, consider using a custom curated database — see how to upload a custom database for more information.
Filters
The annotation table can be filtered in several ways:
- FDR % — the primary filter, defaulting to 10%. Controls which annotations are shown based on confidence threshold.
- Database — filters annotations to a specific database from those selected at upload. Without this filter, the same annotation may appear multiple times (once per database); use the database column to distinguish them. Note that FDR and isomeric molecules may differ across databases for the same annotation.
- Adduct — filters by adducts selected at upload.
- Molecule search — accepts a neutral sum formula (returns all matching annotations) or a formula with adduct (returns only that specific annotation).
- m/z search — displays all annotations within ±1 of the entered m/z value.
- Show/hide off-sample — toggles visibility of annotations flagged as off-sample during the annotation pipeline. See the off-sample guide for more information.
Colocalization
The second collapsible panel — after Molecules and before Diagnostics — shows the top co-localized annotations for the currently selected annotation, along with their ion images. See the colocalization guide for a full explanation of how colocalization is computed and how to interpret and filter the results.
Common patterns and pitfalls
- Observed intensities well above theoretical — a likely sign of isobaric overlap with another ion. Check the isobaric ions column.
- Same annotation appearing multiple times in the table — you're viewing annotations across multiple databases without the database filter applied. Enable the database column to see the source.
- High number of isomeric molecules — common in MS1 data and not a reflection of annotation quality. A custom database is the most effective way to manage this.
- FDR differences between isomeric ions — this reflects adduct-level scoring, not molecular likelihood. Don't use FDR to choose between isomers.